Dashboard
Artifacts
- SQL investigation file
- Ten-page case study with quantified recommendation
- Seven-slide presentation deck and README
Case study 02
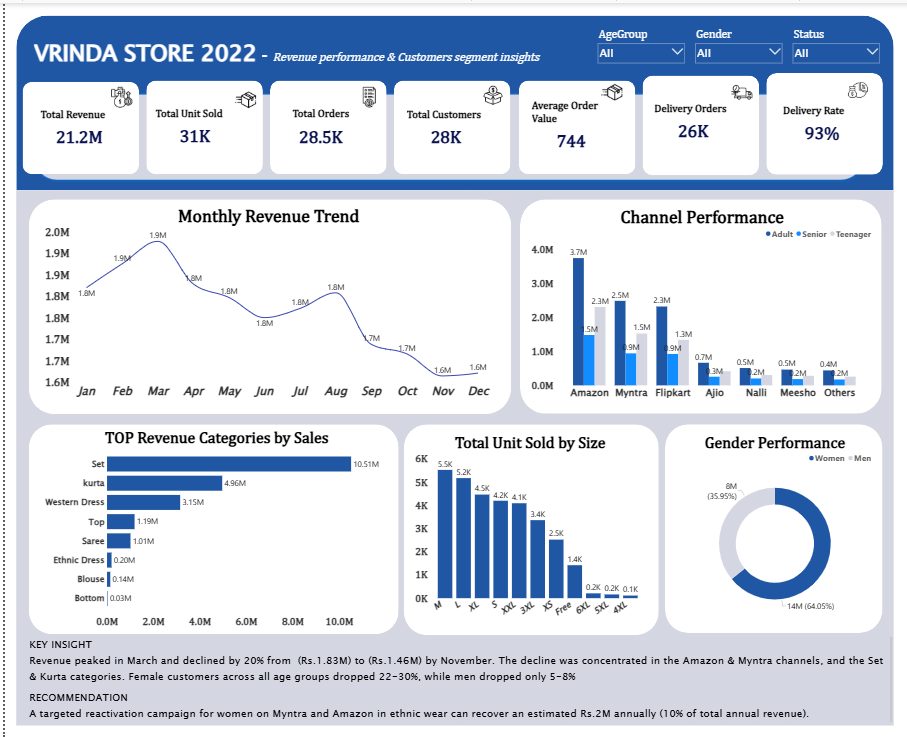
Order-level data for an online clothing store showed revenue falling. The question: where exactly is the decline concentrated, across channels, categories, geography, and customer segments, and what would it take to recover it?
A full SQL investigation over 31,047 order rows, segmenting revenue by sales channel, product category, demographic group, and order status, then isolating which segments account for the decline rather than averaging it away. The findings and the recovery math are documented step by step in a ten-page case study so a reviewer can trace every figure back to a query. Vrinda case study
The investigation ends in a recovery estimate of approximately Rs. 2 million, built from the identified decline segments, with the supporting math shown in the case study and presentation deck rather than asserted. Vrinda case study · deck