Dashboard
Artifacts
- Four-page Power BI report with DAX measures
- Six-slide CEO Profit Brief deck
- Executive summary and README
Case study 03
Revenue is not the same as profit. Framed as a briefing for a chief executive: where in this global retail business is profit actually made and lost, and which levers, discounting, delivery performance, product mix, deserve attention first?
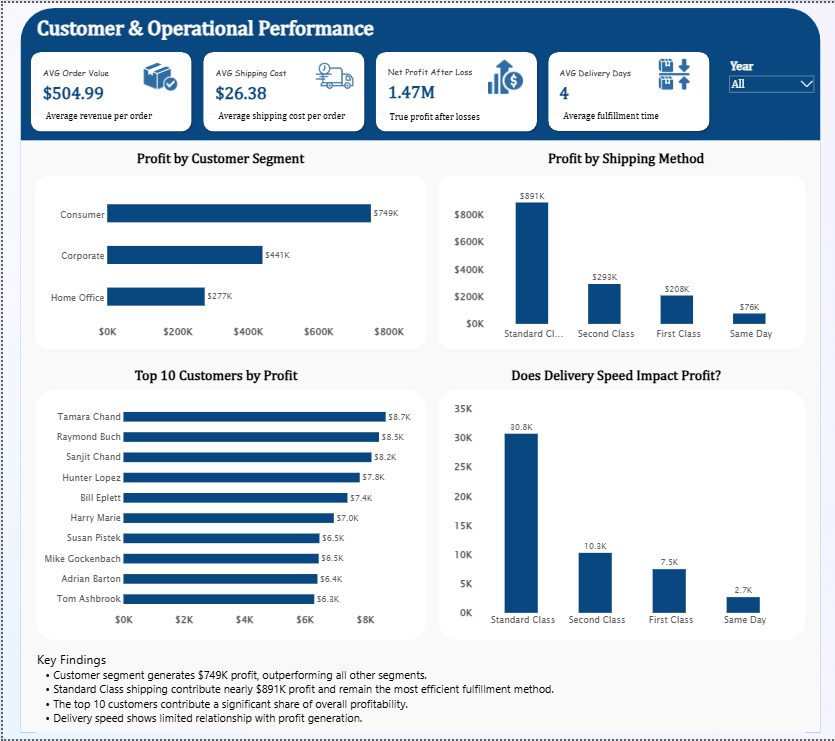
A four-page Power BI report structured as a drill-down: an executive overview page first, then dedicated pages that decompose profit by segment, examine the relationship between discount bands and margin, and test how delivery time relates to outcomes. DAX measures drive the KPIs, and the companion deck pairs each dashboard page with a business question, the finding, and the recommendation, so the numbers are never presented without their so-what. Superstore deck · exec summary
The project is deliberately framed as a document a CEO would receive: one page of headline KPIs, then evidence pages behind each claim. Every figure on the deck is matched against the dashboard before publication. Superstore deck
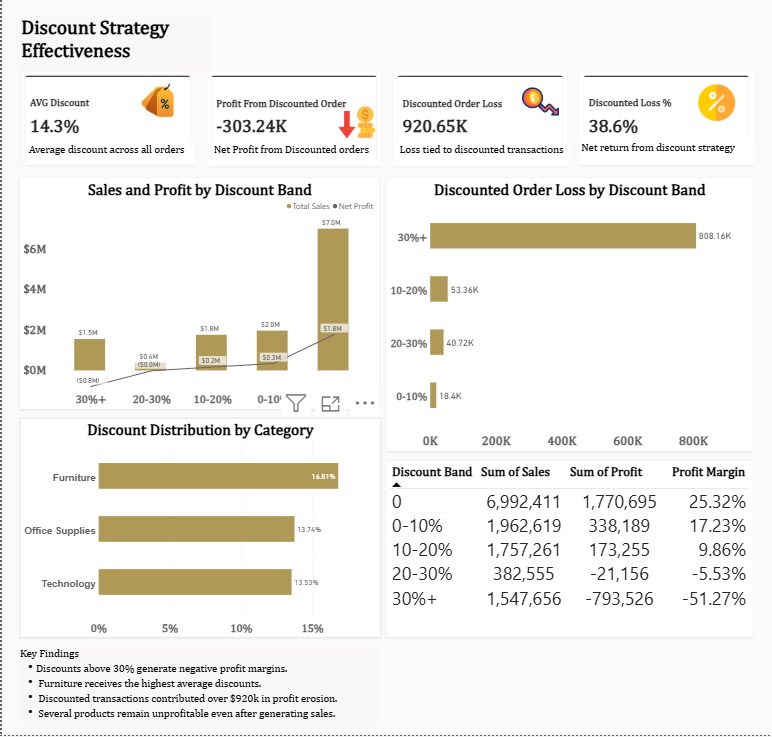
The discount-band analysis shows profit margin falling from 25.32% on undiscounted orders to -5.53% at 20 to 30 percent discount and -51.27% above 30 percent, where discounting stops being a growth lever and becomes the leak. Superstore dashboard · Discount Strategy
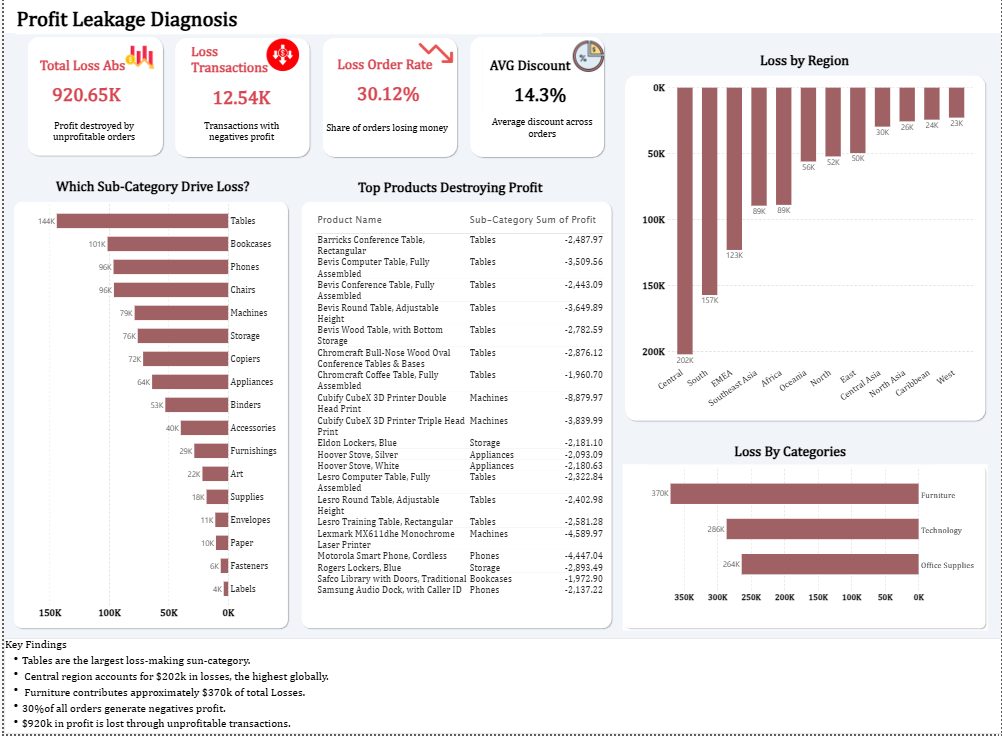
30.12% of orders lose money. The loss concentrates in Tables and Furniture, and the Central region alone accounts for $202K of losses, which points spending controls at specific sub-categories and regions rather than across the board. Superstore dashboard · Profit Leakage